
SRA metadata sex prediction
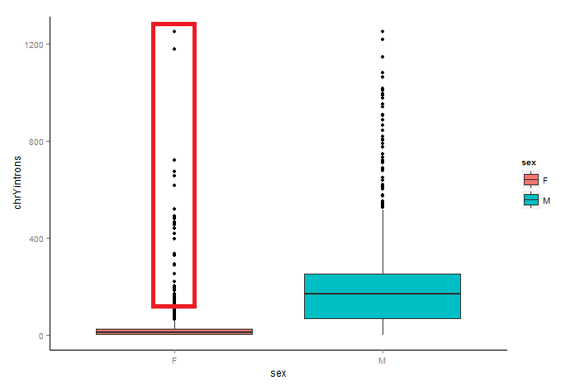 Figure 1
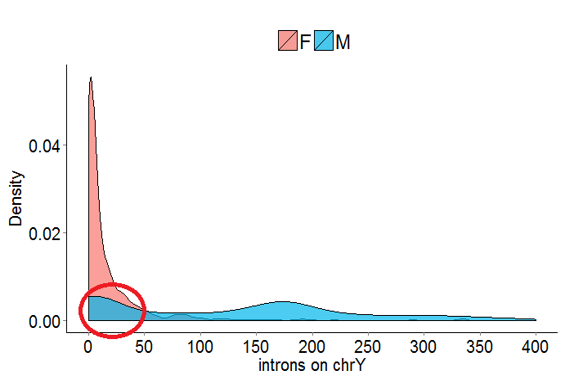 Figure 2
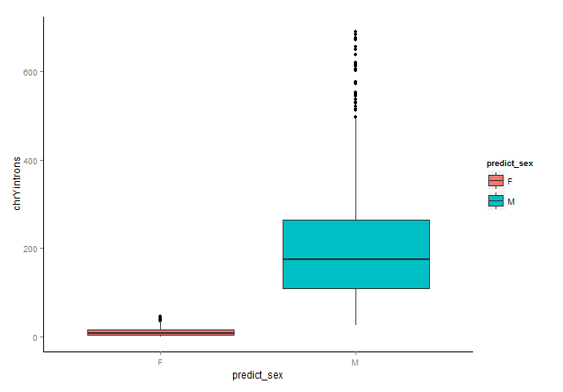 Figure 3
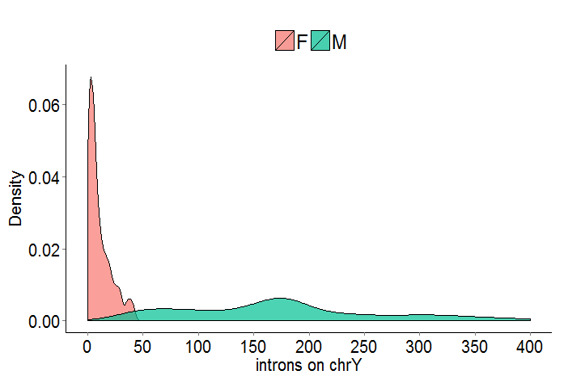 Figure 4
Fig 1 & Fig 2: SRA contains 2969 samples which have sex labeled. Fig 1 plots the number of introns on chrY for 2969 SRA samples for males and females based on sex labels in SRA. I use the red box to circle the female outliers which have too many introns on chrY. Fig 2 is the density plot on number of introns for 2969 SRA samples for males and females based on sex labels (female in red, male in blue) in SRA. I use the red circle to show the male outliers which have too few introns on chrY.
Fig 3 & fig 4: I use the number of introns on chrY and total number of introns across chromosomes as predictors to build the random forest sex prediction model. Fig 3 plots the number of introns on chrY for 2969 SRA samples for males and females based on model predicted sex. Fig 4 is the density plot on number of introns on chrY for 2969 SRA samples for males and females based on model predicted sex.
Check code for this project srametasex on Github Repository
quick installation:
devtools::install_github("SiruoWang/srametadata")